A vibrant infographic showcasing traction in a circular layout. Bold, sans-serif fonts highlight key metrics. Bright colors emphasize data points: 45 tacos sold, 90% approval. Outlined icons represent taste testing, sales simulations, and customer feedback. Pie charts illustrate success visually, creating a balanced and engaging presentation of business achievements.
Created with Infographic Graphic Generator
See More

Textured puddles, reflecting light in vibrant hues. Smooth surface types create an enigmatic allure. Abstract patterns i...

A collection of textured surfaces showcasing smooth gradients, vibrant colors blending into one another, puddles reflect...

Infographic design featuring prominent elements: "Approved by Panelists" section highlighted with a large green check ma...

Infographic layout featuring a vibrant, eye-catching design. Dominant bright colors creating an energetic atmosphere. Bo...

An engaging infographic featuring a vibrant color palette with bright yellows and reds. Outlined icons representing taco...

A vibrant infographic showcasing traction in a circular layout. Bold, sans-serif fonts highlight key metrics. Bright col...

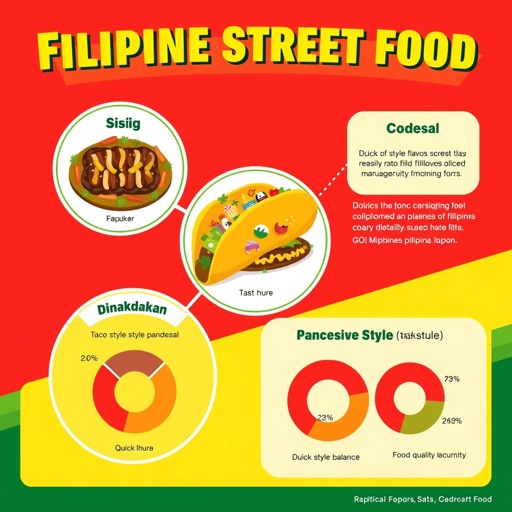
A vibrant infographic featuring Filipino street food offerings. Circular layouts showcase three distinct flavors: Sisig,...

A sprawling, once-vibrant city reduced to shattered remnants under a colossal, deep blue ray from the cosmos. Jagged bui...

A vast city lies in ruins, structures crumbled beneath the colossal, deep blue ray from space. The planet is split, reve...

Three figures shrouded in flowing, ornate black garments, the fabric whispering against the cool night air. Silvery moon...

Three women in sleek, futuristic black attire, bold geometric patterns accentuating their forms. Nighttime desert, endle...

A detailed diagram displaying cultural identity and gendered space in Tehran home design. Central node surrounded by mai...

An intricate diagram showcases the interplay between safety, cultural identity, gendered space, and home design in Tehra...

A detailed diagram illustrating the interaction of cultural identity and gendered space in Tehran home design. Central n...

A single, elegant rose in soft shades of gray and white, petals unfurling gracefully. Surrounding the bloom, a watercolo...

A delicate arrangement of roses, soft petals infused with various shades of gray and white. A watercolor gradient backgr...

Icon of a sleek modern office staircase, five minimalist steps ascending gracefully. Gradient colors blend seamlessly fr...

Iconic modern office staircase with five sleek, minimalist steps. Clean lines and geometric precision define the structu...

Icon, a sleek modern office staircase with five polished wooden steps, surrounded by glass railings, natural light strea...

Icon of an ornate staircase with five intricately designed steps, each step adorned with delicate carvings of mythical c...

Icon of serenity, glowing softly, surrounded by a halo of ethereal light. Delicate floral motifs intertwining, vibrant c...

Illustration of a dreamscape, floating islands suspended in the sky, whimsical creatures with elongated limbs, oversized...

A dark, labyrinthine dungeon filled with ancient stone walls, flickering torches casting eerie shadows. At the center, a...

A vibrant bar chart, showcasing various types, stands out against a soft, pastel backdrop. Each bar elegantly displays e...

Concept art blending fantastical landscapes and mythical creatures. Intricate ink sketches highlighting lush forests, to...

A mystical forest shrouded in twilight, towering ancient trees entwined with glowing vines. Ethereal creatures peeking t...