AI comparison chart maker
Put the options side by side and let one win
Every buying decision is a comparison; smart brands design the table themselves. Generate comparison charts — feature grids, us-versus-them columns, plan matchups — with checkmarks and hierarchy that quietly favor the right answer.
- Painted from your words — no templates, no stock libraries
- Bring your logo or photos along as references
- Every look from flat vector to glossy 3D render
- Edit, mock up, upscale or animate anything you make
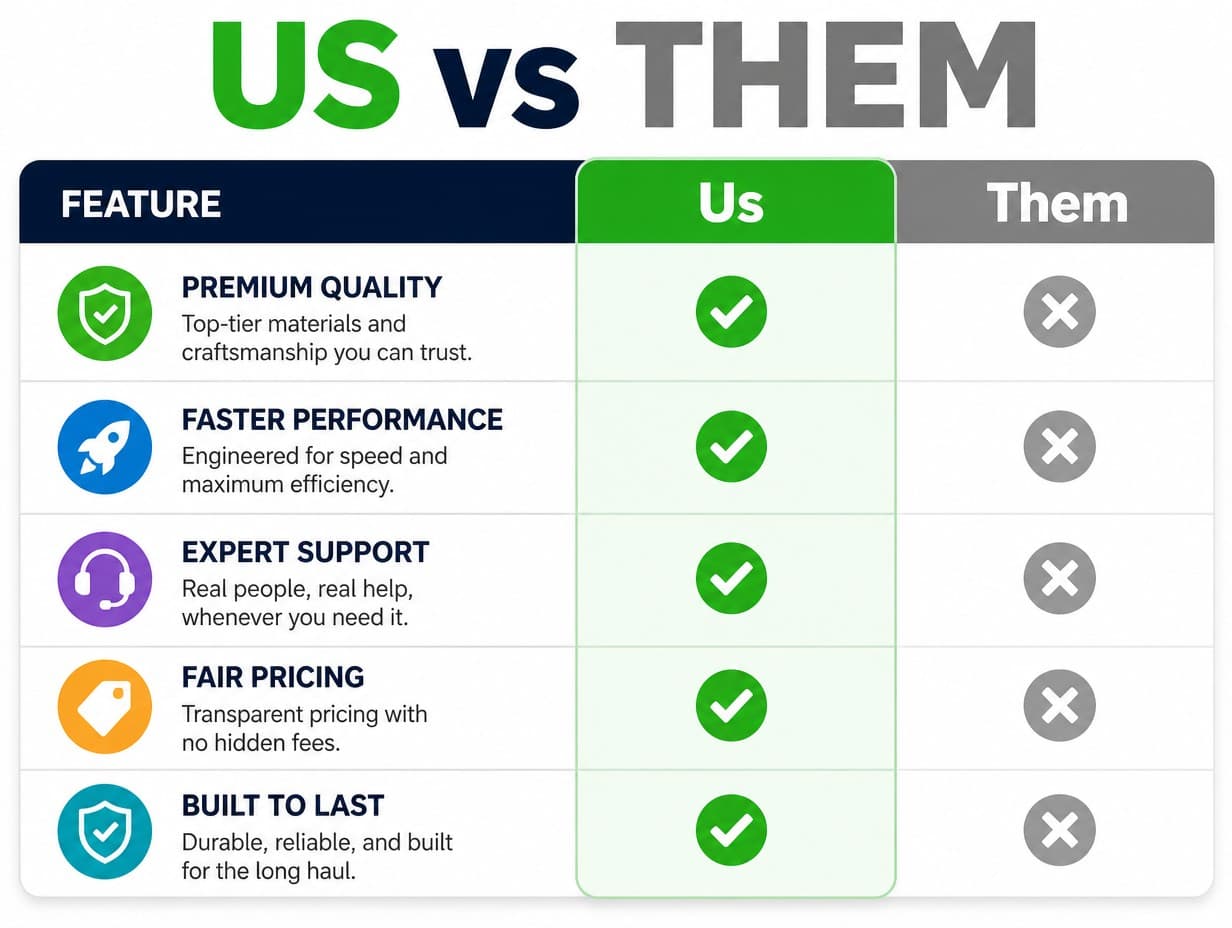
Made with Graphic Generator — “Comparison chart graphic with two columns “Us” and “Them”, five feature rows wit…”
Steal one of these prompts
Before you hit generate
Two or three columns only — a fair fight reads clearer than a lineup
Lead the rows with the features where you win
Green checks and gray dashes communicate faster than words
Highlight your column with a subtle tint, not a shout
Straight from the community feed


Good questions, straight answers
How do I make a comparison chart with AI?
Type one sentence describing the comparison chart you want — the subject, any words it should carry, the palette, the mood — and the generator paints a finished graphic in about twenty seconds. Not quite right? Reword and rerun until it is.
Can the comparison chart include my logo or my own photos?
Yes. Attach up to four reference images — a logo, a product shot, a portrait, an earlier graphic — and the AI works them into the new comparison chart so the result stays unmistakably yours.
Is the comparison chart maker free to try?
Graphic Generator is free to try — sign up and make your first graphic on the house. When you need more, plans start at $15/month for 1,000 credits, and one-time credit packs never expire.
Who owns the comparison chart?
You do — the graphics you make here belong to you; see our Terms of Service for the details. Public graphics appear in the community feed; keeping graphics private is a subscriber perk. And since copyright law varies by country, we can't give legal advice — ask an expert about specific cases.